Wednesday, January 04, 2006
Semb. KimsTrans
Sembawang Kimtrans Ltd. (SKL) subsidary of Sembawang Logistics Ltd. which is a subsidary of Semb. Corporation. Sounds complicated? Semb. Corp. is owned by Singapore Technologies, which is owned by Temasek Holdings. The big daddy of all is of course, the Ministry of Finance.
SKL, is a company providing integrated logistics and specialising in Marine and Mining Logistics. In recent years, the net profit of the company has risen tremendously. From $2.08 million in FY2003 to $6.07 million in FY2004. This translates to a 222% increase. This quantum leap could be explained by the rise in crude oil prices which fueled exploration of gas and oil. This indirectly leads to the need for more integrated marine logistics. Other key fundamentals worth noting would be the EPS, it rose from 0.21cents in FY 2002, to 0.68cents in FY2003 to 2.14cents in FY2004. What a rosy picture indeed. This company is truly making money!
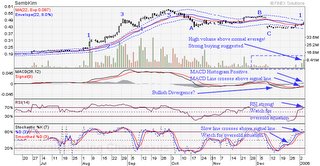
Earlier in september, the stock price reached a peak of $0.585. Since than its price has been in correction and is about to start another up cycle. I hope through the charting be able to catch this new cycle.

1. 22 MA turning up.
2. Bullish divergence spotted in MACD Histogram.
3. MACD Histogram is positive.
4. MACD line crosses above signal line.
5. RSI is strong but be cautious of overbought situation (my mistake in the chart).
6. Slow Stochastics line crosses above signal line but be cautious of overbought situation (my mistake in the chart).
7. High volume today is above the normal average suggests strong buying interest.
Not bad for a start! These are indeed some bullish signals. I would get in now at 0.47 and put a stop loss at 0.42. If you notice the 1-5, A-C markings, they are part of the Elliot Wave Theory, suggested by someone in the 1920s. I wonder if this theory is applied correctly in this case. Nonetheless, it could point towards the start of another wave cycle starting at 1! Lets see if this technical analysis will predict the upward movement of this counter.
Lets make lots of Money$$$
SKL, is a company providing integrated logistics and specialising in Marine and Mining Logistics. In recent years, the net profit of the company has risen tremendously. From $2.08 million in FY2003 to $6.07 million in FY2004. This translates to a 222% increase. This quantum leap could be explained by the rise in crude oil prices which fueled exploration of gas and oil. This indirectly leads to the need for more integrated marine logistics. Other key fundamentals worth noting would be the EPS, it rose from 0.21cents in FY 2002, to 0.68cents in FY2003 to 2.14cents in FY2004. What a rosy picture indeed. This company is truly making money!
Earlier in september, the stock price reached a peak of $0.585. Since than its price has been in correction and is about to start another up cycle. I hope through the charting be able to catch this new cycle.

1. 22 MA turning up.
2. Bullish divergence spotted in MACD Histogram.
3. MACD Histogram is positive.
4. MACD line crosses above signal line.
5. RSI is strong but be cautious of overbought situation (my mistake in the chart).
6. Slow Stochastics line crosses above signal line but be cautious of overbought situation (my mistake in the chart).
7. High volume today is above the normal average suggests strong buying interest.
Not bad for a start! These are indeed some bullish signals. I would get in now at 0.47 and put a stop loss at 0.42. If you notice the 1-5, A-C markings, they are part of the Elliot Wave Theory, suggested by someone in the 1920s. I wonder if this theory is applied correctly in this case. Nonetheless, it could point towards the start of another wave cycle starting at 1! Lets see if this technical analysis will predict the upward movement of this counter.
Lets make lots of Money$$$